There seems to be a soft limit for E2E tests in Salesforce. Once you hit it, your tests will start to fail with the dreaded „unable to lock row“ exception. This is one of the nastiest errors you can encounter, especially in tests. It’s hard to debug and even harder to solve. Additionally, you might experience inconsistent and degraded performance. We hit this limit a couple of weeks ago and I was tasked with investigating the problem.
Even though I was not able to find the silver bullet, I have learned so much during this technical investigation. This is why I chose to share my analysis and findings. Bear with me, because there are a couple of things you can do to circumvent the problem (albeit you cannot solve the root cause, which is up to Salesforce).
This post is about all the things you can do to optimize and scale your tests, so you do not need to mock queries and DML. How to properly mock the selector layer and DML is a different topic.
Understanding „Unable To Lock Row“ In Context Of Tests
Understanding the root cause of the UNABLE_TO_LOCK_ROW exception helped me a lot when I was considering options to fix our tests. The error essentially has three parts:
- Record locking, that is used to ensure referential integrity of your data.
- The automatic rollback of the apex test framework, that is performed between test methods.
- Parallelization of the Apex test runner (or, as it turns out, the limitations of this parallelisation)
Every once in a while, the automatic rollback collides with the record lock from a previous test. This only appears to apply to tests, that are not executed in parallel. The more complex your domain layer (validation rules, triggers, and flows) and the more complex your test data, the more likely you are to run into that random collision. This makes your tests unreliable.
Solving „Unable To Lock Row“
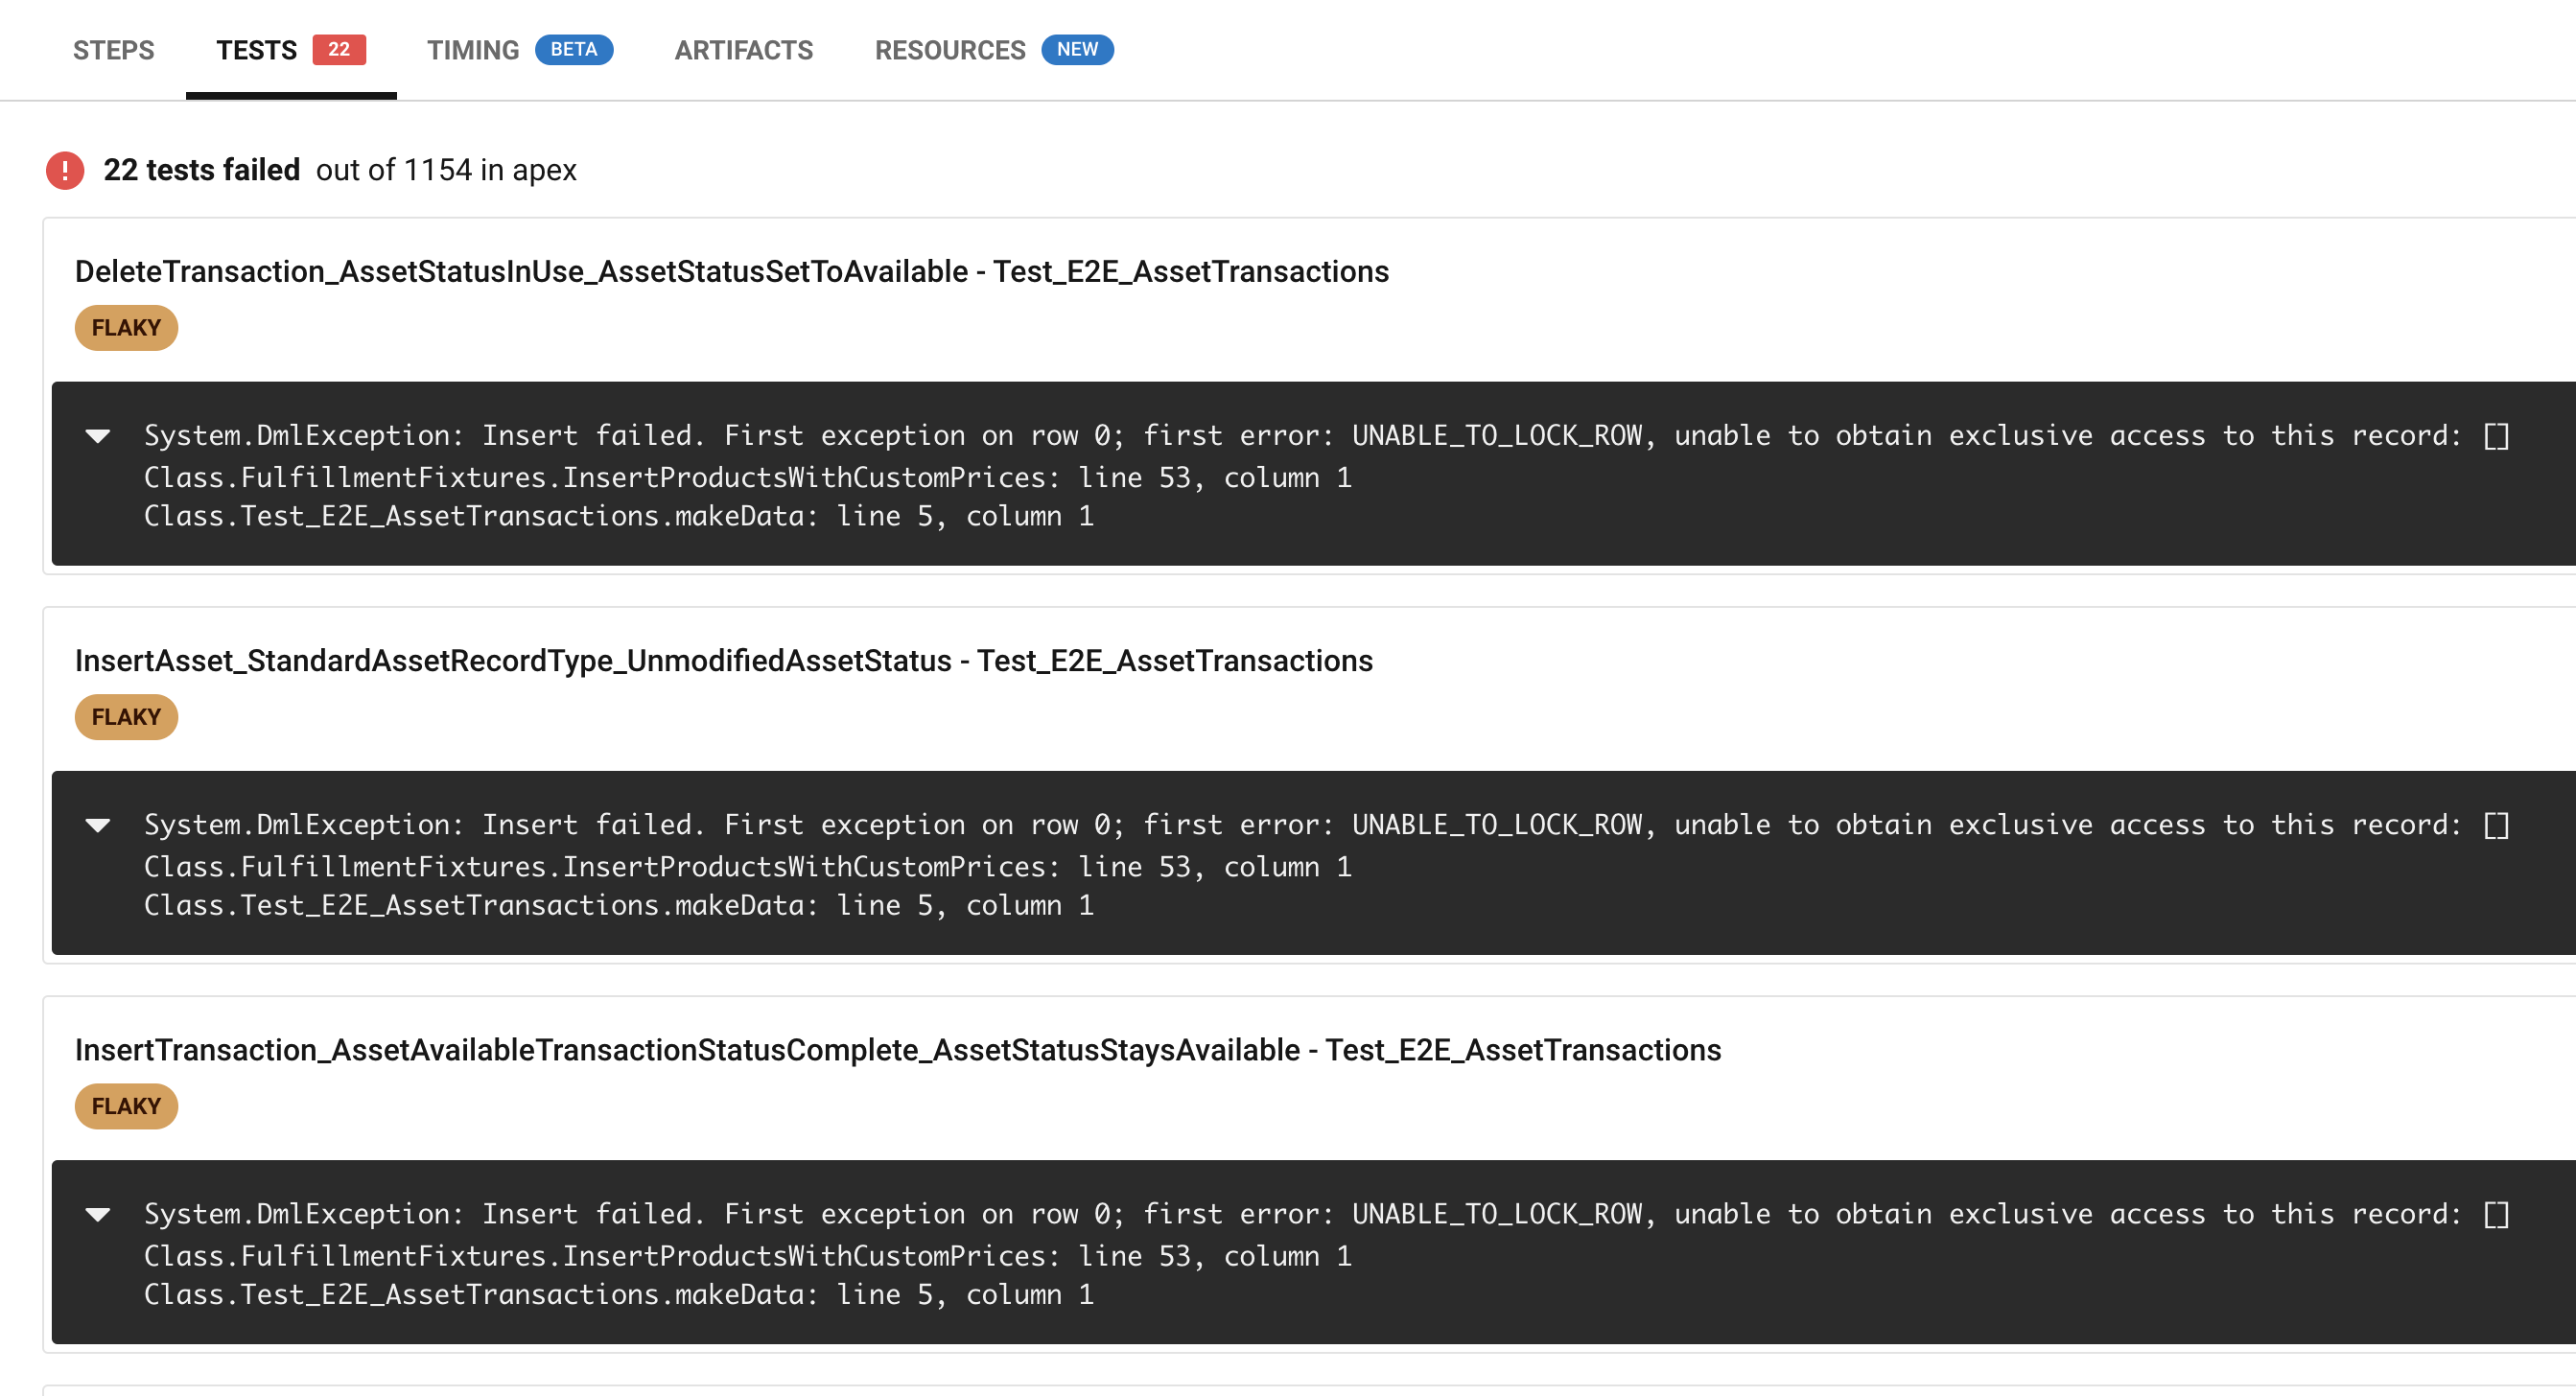
In our case, we only faced errors on test fixtures that made use of products (Product2) and price books (Pricebook2). Interesting to note, that the error occurred when inserting Product2 records. As we will see, the Product2 object was not the underlying cause. So if your tests throw the UNABLE_TO_LOCK_ROW exceptions on other objects, these findings may still apply. If this screenshot somewhat looks familiar to you, then this post is for you.
Before we dive into what you can do, here’s a brief overview of what doesn’t work:
- Adding
FOR UPDATEto queries in test context. This actually worsened the problem and caused significantly more unable to lock row exceptions. In fact, I was only able to reproduce the error with my test setup after I added some test classes that usedFOR UPDATE. - Disabling parallel testing (Globally and with
isParallel=false). A benchmark showed, that tests were already executing in sequence, no matter the setting. - Implementing different fixtures, instead of reusing the same fixtures in each test. Even though I have never seen two classes with different fixtures fail at the same time, I was not able to verify this either. So this might be voodoo.
- Disabling
seeAllData. This did not apply, because our tests never saw all data in the first place.
However, there are things you can do. Let’s investigate.
Investigating Test Parallelisation
As it turns out, there was a single culprit to all our problems: Test.getStandardPricebookId(). All test classes included in a run that use this line are executed in sequence, not in parallel. Over the course of running more than 700 full runs (more than 800.000 tests in total), these were the only classes that we ever saw failing.
If tests execute in sequence, this typically means they use the same database. Consequently, they have to wait until all changes that were made by the previous test are rolled back. For larger tests with a complex domain layer, this causes massive accumulating waiting times and the risk of a race condition, eventually causing the „unable to lock row“.
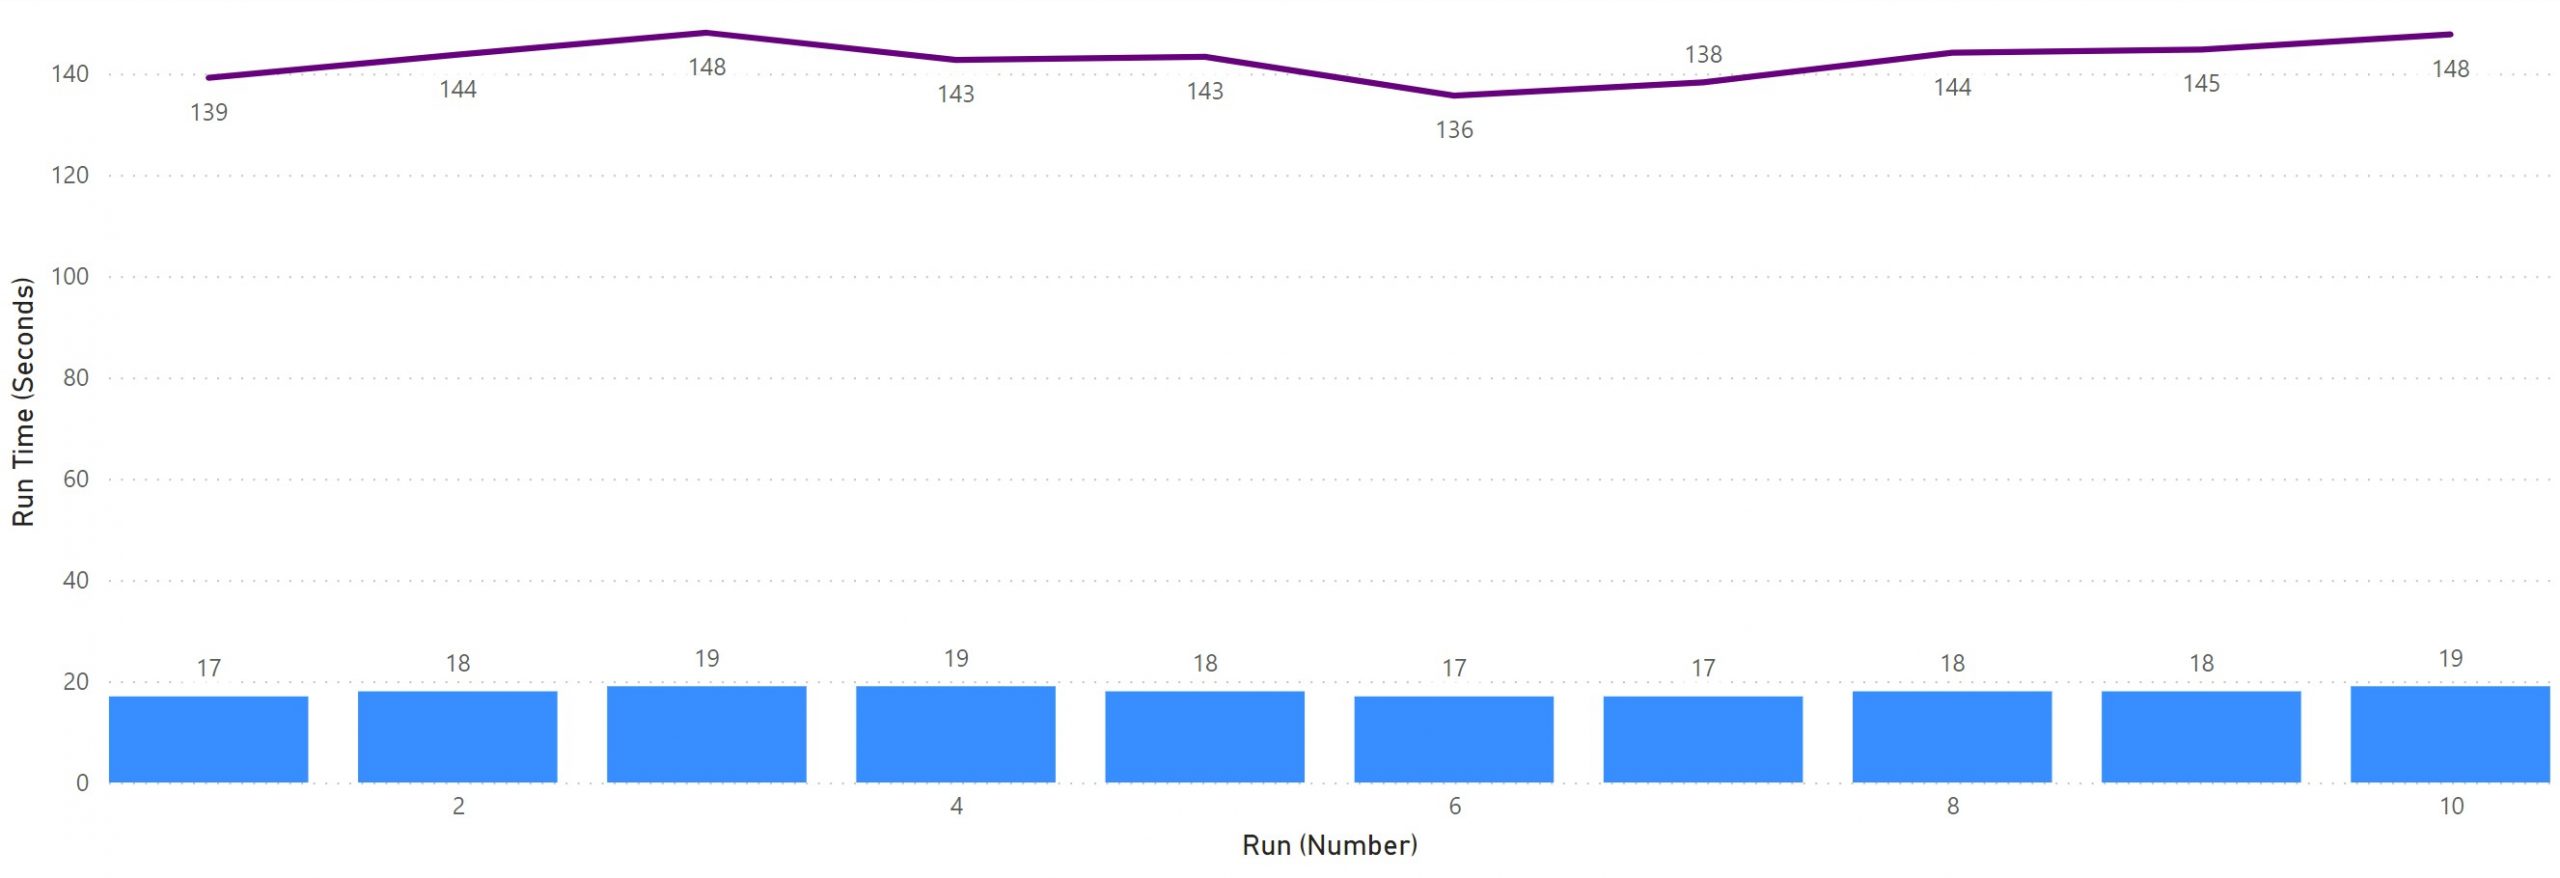
To prove that, I compared the command time of two runs: One that includes a price setup and one that doesn’t. Here are the statistics of a test run that only sets up Products, Accounts, Orders, and Service Contracts (no price setup). As you can see, the accumulated run time of all tests (purple line) is in the 140-second range, but the run time of the command (blue bars) is 18 seconds on average.
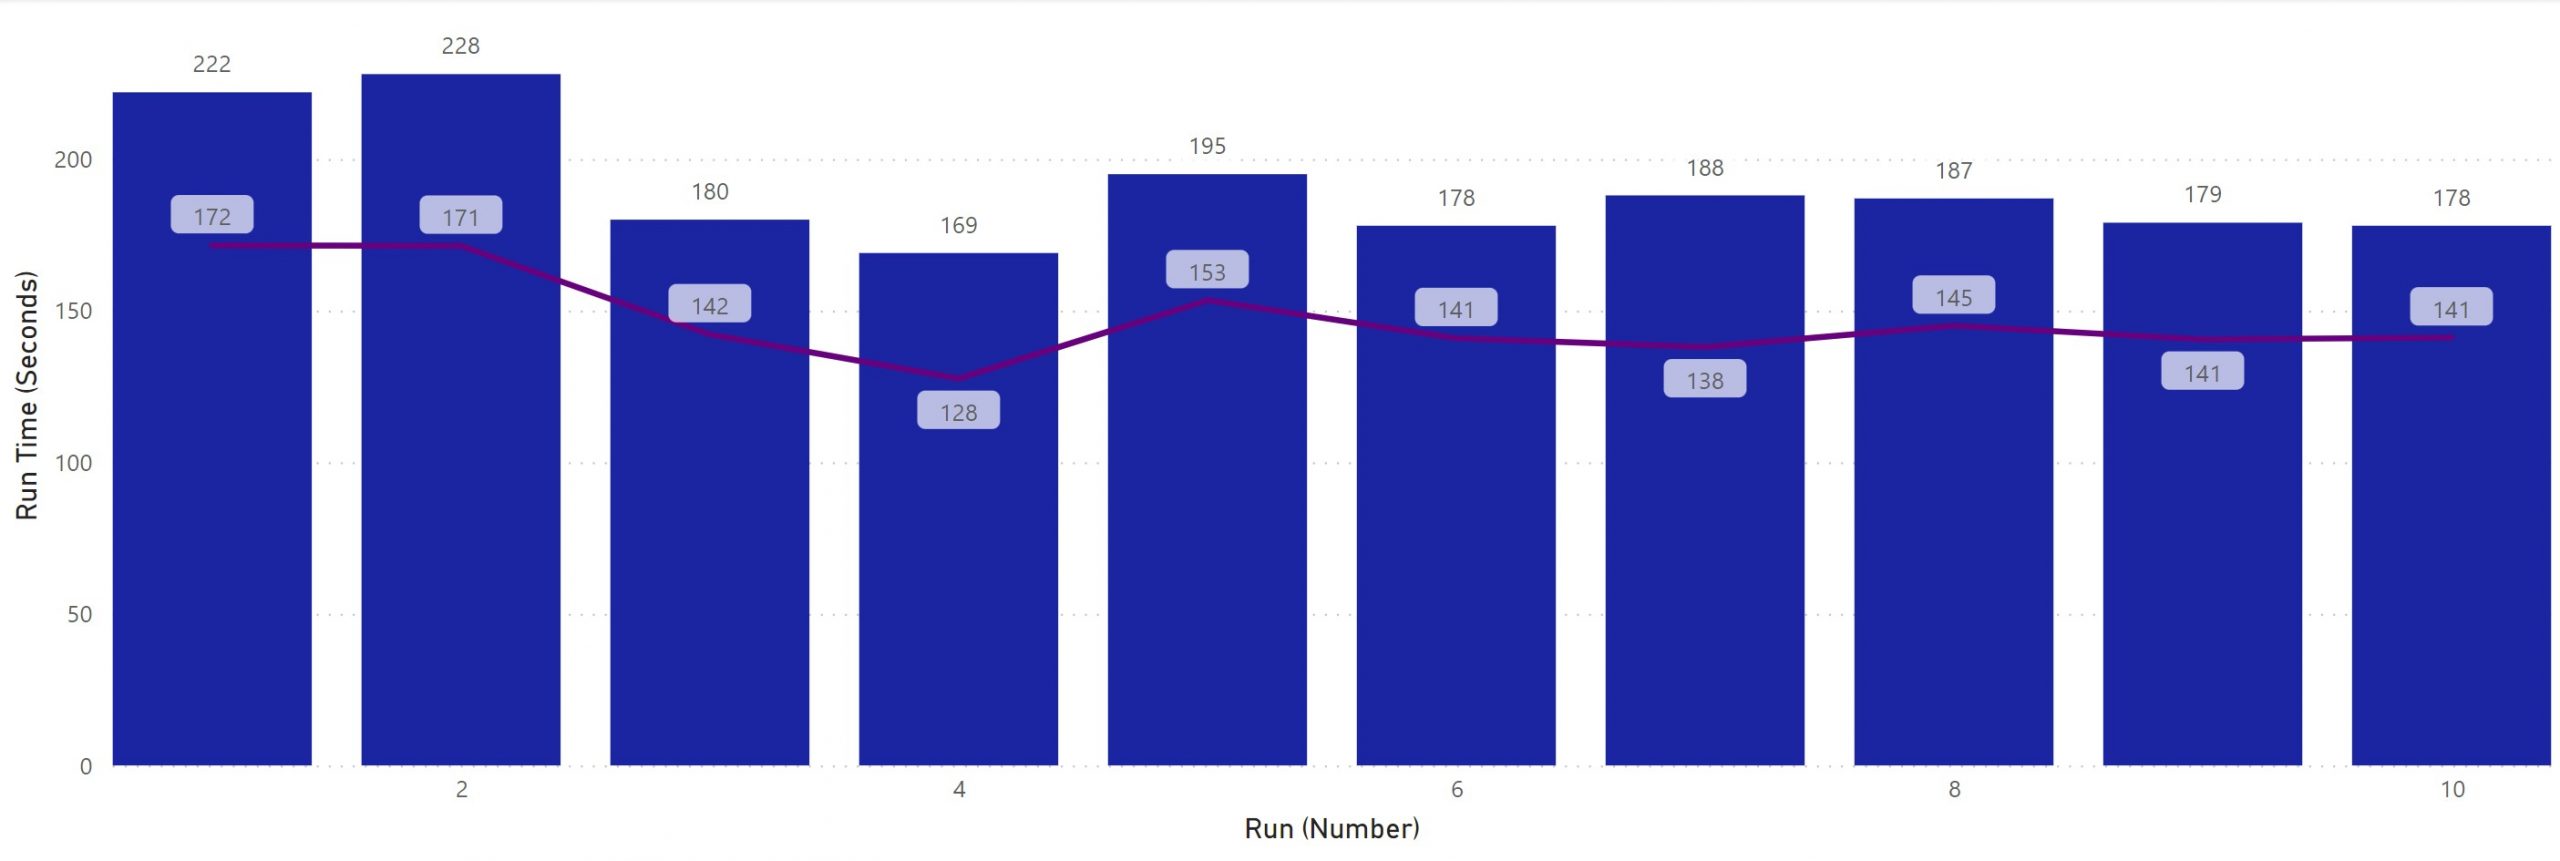
Now compare this with the test run that executes the exact same tests, but includes the price setup in its fixtures (therefore, calling Test.getStandardPricebookId). The accumulated run time of tests only slightly increases to 145 seconds, but the run time of the command surges to 190 seconds on average. Notice, how one command now takes longer to complete than the total time of all its test methods. This hints us to a shared database that is rolled back between executing classes.
Equipped with this knowledge, it is a cakewalk to optimize and fix our tests.
Two Immediate Fixes For „Unable To Lock Row“ And Slow Tests
Let’s get to the bottom of it. We identified the usage of the standard price book as the root of all evil. Now, all we have to do is remove the price setup from tests that don’t need them and isolate tests that depend on prices from the rest of our tests. Then, we optimize the test execution itself for more reliability, scalability, and performance.
If your tests cannot execute in parallel, the total amount of data they set up matters a lot. This is not so relevant for tests that run in parallel, by the way. To verify this, I ran two benchmarks large fixtures vs. small fixtures and large classes vs. small classes. In total, the following benchmarks were run:
- Large setup with 200 products and prices, execute product tests only in small classes
- Large setup with 200 products and prices, execute all tests in small classes
- Minimal setup with 2 products and prices, execute product tests only in small classes
- Large setup with 200 producs and prices, execute product tests in large classes
- Minimal setup with 2 products and prices, execute product tests in large classes
So all we need to do is to reduce the complexity of our fixtures for affected tests. Here are two strategies.
Simplify Your Fixtures
It is particularly interesting, that tests with large data sets execute exponentially slower than tests that only set up a few records. While the run time is only 3 times higher, the whole command takes 6 times longer to complete. Notice, that the full run does not execute slower than the „products-only“ run.
| Fixture Type | Mean Run Time | Mean Command Time |
|---|---|---|
| Large Setup (Products only) | 200 sec | 540 sec |
| Large Setup (Full run) | 300 sec | 540 sec |
| Minimal Setup | 65 sec | 90 sec |
This becomes obvious once you understand, that all tests that make use of the standard price book run on the same database. Hence the more complex their fixtures and the more logic in the domain layer, the higher the probability of a collision. The more sequential classes you add to a test run, the higher the discrepancy. Here are three rules to follow, when you design your test fixtures:
- Use as few records as possible. If you have tests that do need a large set of records, create dedicated fixtures for them. Do not reuse large fixtures for other tests that do not depend on this amount of data.
- Isolate price setup from the rest of your tests, wherever you can. Do not use
Test.getStandardPricebookId()unless you absolutely need to. - Only setup the test data that you actually need in your tests. Do not reuse a large fixture that was used in another E2E test just for the sake of reusing it. It is better to break the DRY principle than to re-use large fixtures.
Bulk Your Tests
Because tests that use price books do not run in parallel anyway, it is more efficient to put them into larger test classes. The more complex your domain logic, the more you will benefit from this.
Here’s a benchmark of two almost identical test runs: Both use the same fixtures and execute almost the same tests, but one of them executes large classes with 50 tests, while the other executes many small classes with 10 or fewer tests.
| Run Type | Mean Execution Time | Mean Run Time |
|---|---|---|
| Small Classes (250 test cases in 25 classes) | 200 sec | 540 sec |
| Large Classes (240 test cases in 9 classes) | 190 sec | 420 sec |
The more is going on in your domain layer, the larger the difference in the run time you will observe. It is extremely important to understand, that only tests executed in sequence will benefit from this change. Tests that execute in parallel complete much faster, if you limit the size of your classes. 20 to 25 tests is a good rule of thumb. Keep these simple rules in mind:
- When testing logic that depends on price book entries (Opportunities, Service Contracts, etc), separate the tests from other tests that do not need them. This way, the majority of your test classes can execute in parallel.
- When you have a class that sets up products with prices, cram as many tests as possible into it. Especially for a complex domain, this will be faster than lots of small classes.
Batch Your Test Execution
After optimizing the tests themselves, now optimize the test execution. Batching your tests is the only surefire way to prevent UNABLE_TO_LOCK_ROW exceptions while still maintaining E2E confidence. If done correctly, it allows scaling almost indefinitely. It is also a prerequisite for scaling horizontally (executing different portions of your tests on multiple sandboxes simultaneously).
The idea is simple: Instead of executing your tests all at once, you execute them in batches. Because unreproducible errors usually appear on large test runs, slicing them into smaller batches typically solves the problem.
How To Organise Your Tests In Batches
This can be achieved easily using Test Suites. There’s only one downside: You need to manually add these test suites to your test execution step in your CI pipeline. This creates a little bit of management overhead for your DevOps team. To wrap it up, here is how we solved it:
- All of our packages use the 1-1-1 template, therefore a single package does not know about test suites. Instead, we have a „happy-soup“ repository where test suites are maintained. After a new package version is released, new test classes are registered with the respective test suite.
- We modified the steps that execute the staging and production test run: Instead of executing all tests in the org, they run specified test suites instead (the scratch org test run still executes all tests, though). The test suites should be kind of stable. Once you introduced them to your CI, changes to the number and names of test suites should be rare.
How To Execute Test-Batches In A CI Pipeline
Here’s the shell script that iterates an array of hard-coded test suites (line 3) and returns the last non-zero exit code if a command failed (or zero, if all commands succeeded). You can easily modify this to query the org for its test suites and execute them dynamically instead.
mkdir -p test-results/apex
set +e
testSuites=(Test_Suite_1 Test_Suite_2 Test_Suite_3 Test_Suite_4)
finalExitCode=0
for testSuite in ${testSuites[*]}
do
    printf "Executing test suite %s ... \n" $testSuite
    printf "sfdx force:apex:test:run -w 10 -r junit -d test-results/apex -s $testSuite\n"
    sfdx force:apex:test:run -w 10 -r junit -d test-results/apex -s $testSuite
    exitCode=$?
    if [[ ! $exitCode == '0' ]]; then
        finalExitCode=$exitCode
    fi
    printf "Last exit code %s\n" $exitCode
done
printf "Final exit code %s\n" $finalExitCode
return $finalExitCode
Simply add it to the run step that executes your tests on a staging or production deployment.
About The Benchmark
All code and the raw results of my benchmarks are published in a repository on GitHub. All the benchmarks were executed on scratch orgs, so the overall performance may vary if you execute your tests on a production instance.
Whenever I modified the same test classes to run a certain benchmark, I tried to put the changes and the benchmark results in the same commit. So check out the commit history, if you plan to reproduce my findings.
Here are the key metrics you can observe if you want to check if you are at risk of running into UNABLE_TO_LOCK_ROW exceptions:
- Do you have a high variance in the individual run times of your tests?
- Is the accumulated run time of your tests lower than the command time?
If the answer to one of these is yes, you should take a look at the optimizations. If you exhausted all options, you can still batch your test runs.
Summary
After a lot of detours and failures, I was finally able to pin down the problem to how Salesforce parallelizes test execution. What started as an investigation of how to solve a particular error ended up as optimization of our test performance. I was able to dramatically improve the performance of our tests and developed a strategy to scale them. After all the voodoo I tried, I’d never have guessed that Test.getStandardPricebookId would be the cause of all our problems. To sum it up:
- Take a good look at your codebase and identify tests that make use of price books.
- Use the script to benchmark your tests and compare the command time, test execution time, and test run time.
- Isolate tests that depend on price book entries and move them to separate classes.
- Organise regression tests that you want to execute on staging and production deployments in test suites.
- Integrate these test suites into your CI pipeline to run your tests in batches.
- Once you start hitting UNABLE_TO_LOCK_ROW again, make your batches smaller.
I hope you learned as much as I did.